
If you own a vacant lot in a struggling neighborhood, or you are sitting on a capital gain you hoped to roll into a local project, the ground just moved under you. On November 5, 2026, the Treasury Department and the IRS designated 6,576 census tracts as Qualified Opportunity Zones, effective January 1, 2027. Some blocks that have carried the label since 2018 will lose it. Others are getting it for the first time.
Whether a given parcel sits inside the new map decides something concrete: starting next year, an investor who rolls a capital gain into a Qualified Opportunity Fund tied to that tract can defer tax on the gain, and shelter future appreciation if the stake is held long enough. Move one tract over, and the same deal gets no federal break.
A smaller map than the one it replaces
The new round is leaner than the first. Treasury put the count at 6,576 tracts, of which 2,594 are rural, roughly 39 percent of the map. The original program, launched in 2018, carried about 8,764 zones, so the 2027 map runs more than 2,000 tracts smaller, according to an analysis by OpportunityZones.com, a trade site that tracks the program.
The zones were reauthorized by the 2025 budget law, which made Opportunity Zones a permanent feature of the tax code with a fresh map designated each decade. Governors nominated tracts over the summer; the IRS set the eligibility rules using 2020 census and recent American Community Survey data. Each governor could nominate up to a quarter of the low-income tracts that qualified in their state.
Treasury said every tract a governor nominated within the statutory window made the final list. "The Working Families Tax Cuts permanently renewed and strengthened Opportunity Zones," Treasury Secretary Scott Bessent said in the announcement. The department counted about $110 billion invested through the program since 2017.
How the big states stack up
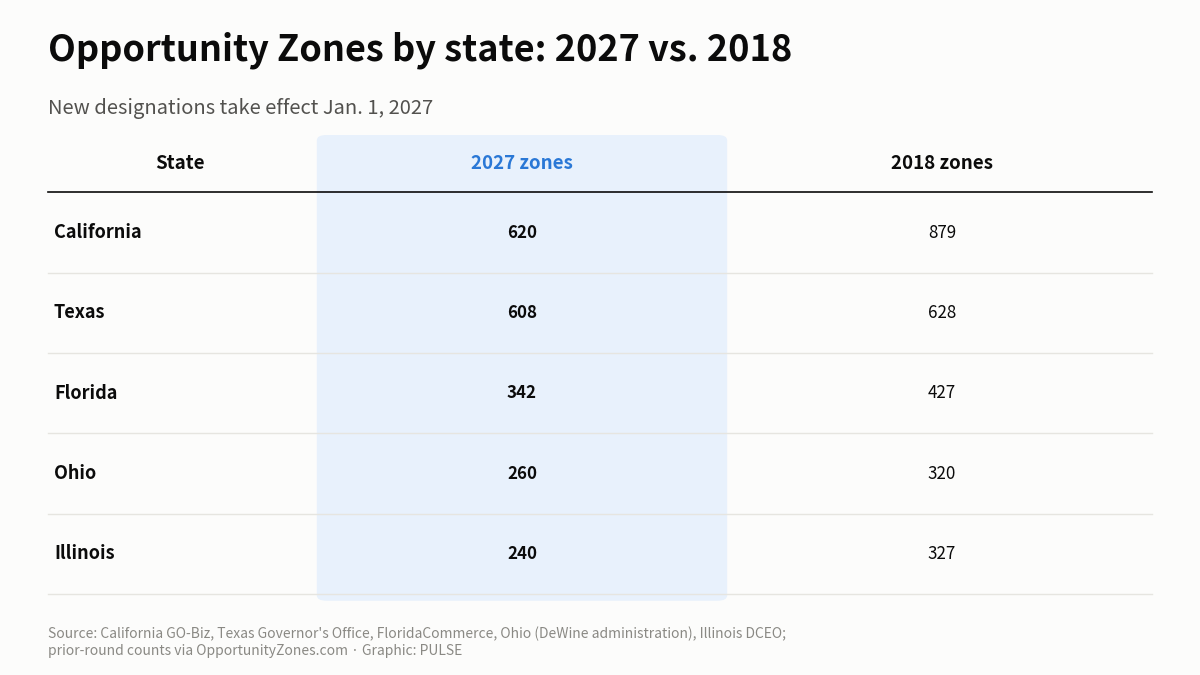
Because each state's cap is tied to how many poor tracts it has, the biggest states still claim the most zones. California leads. Its economic development office says Treasury certified 620 California tracts across 55 counties, covering about 2.6 million people. Texas is close behind: the governor's office reports 608 tracts in 106 counties.
Nearly every large state came out of this round with fewer zones than it held in 2018, a direct result of the smaller national cap. California dropped the most in absolute terms.
| State | 2027 zones | 2018 zones |
|---|---|---|
| California | 620 | 879 |
| Texas | 608 | 628 |
| Florida | 342 | 427 |
| Ohio | 260 | 320 |
| Illinois | 240 | 327 |
Florida's count comes from FloridaCommerce, which set the state's cap at 342 tracts. Ohio's 260 tracts, 96 of them rural, were announced by Gov. Mike DeWine's administration and cross-checked against the OZ 2.0 state tracker. In Illinois, the governor's office said Treasury approved 240 tracts, about a third of them rural. "We identified 240 census tracts with potential to attract new investment," state commerce director Kristin Richards said in that release.
New York is the clear fourth-largest, at roughly 430 tracts by the trade-site tally, but we could not confirm that figure on an official New York state page, so it is not in the table above.
Why your old zone may not be your new zone
The two maps are not the same, and they do not simply overlap. A tract that was a zone in 2018 can be absent in 2027, and a tract that never qualified before can appear now. The old designations do not vanish overnight; the 2018 zones run through December 31, 2028 under the prior rules, with Puerto Rico's expiring a year earlier. That leaves a two-year window where some addresses sit in both maps and some in only one.
For a property owner or developer, that overlap matters. A project that broke ground under a 2018 zone keeps its status for now, but a new fund raised in 2027 looks only at the new boundaries. For a would-be investor, the practical question is narrow: is the specific tract, not the ZIP code or the city, on the 2027 list.
The rural tilt and what it buys
The clearest shift this round is toward rural ground. Rural tracts make up about 39 percent of the new map, a far larger share than in 2018, and Treasury says they qualify for enhanced incentives under the 2025 law. Ohio and Illinois each put roughly a third of their nominations in rural areas, and nationally the program set aside a separate pool of rural-eligible tracts during nomination.
What the rural label buys is a richer tax benefit on the back end for investors who hold rural-zone stakes, a deliberate nudge toward places that drew little Opportunity Zone money in the first round. Whether that capital actually shows up is the open question; the first program's results were uneven, and the enhanced rural terms are untested.
What to check before you count on a zone
Do not assume. Pull the specific census tract for the address you care about and match it against the 2027 designated list, not a 2018 map and not a news summary. Your state's economic development agency is publishing tract-level lists and maps now; the federal designated list sits with the IRS. If you are weighing a deal that depends on the tax break, confirm the tract is on the new list and note whether it is flagged rural, since the benefit differs.
Watch two dates. The 2027 designations take effect January 1 and run ten years, through the end of 2036. The 2018 zones expire at the end of 2028, so any project leaning on an old designation has a deadline. And watch for state pages to firm up: as of today several governors, including New York's, had not posted an official tract list, even though Treasury certified their nominations.
How we checked this
We read the Treasury and IRS announcement dated November 5, 2026, for the national total, the rural count, the effective date and the quotes. State counts come from official pages: the California Governor's Office of Business and Economic Development (620), the Texas Governor's Office (608), FloridaCommerce (342), the Illinois governor's newsroom (240) and the DeWine administration for Ohio (260). Prior-round 2018 counts and the national 8,764 figure come from OpportunityZones.com, a trade site, and we flag them as such because Treasury's release did not list them by state. All figures were confirmed as current on November 5, 2026. We could not confirm a New York tract count on an official state page, and FloridaCommerce's detailed PDF returned an access error when we tried to open it directly, so Florida's figure rests on the agency's stated cap and the trade-site tally. We did not independently recount the IRS tract file. Spot an error? Write to connect@blinkhub.net.
Cover photo: Charles Parker / Pexels